The decision has been made that your institution will be switching to a new reporting tool. The existing tool has been in place for years. There are a multitude of reports that work like a well-oiled machine and haven’t been touched since their creation. However, that is all about to change. What to do now? Where does a report developer even start?
Step 1: Don’t panic
That may seem silly, but it’s true. This is not an insurmountable task. It will be time consuming for a while, but it is achievable. That last statement is something the project sponsor, and those expecting new reports out of your new tool, will need to keep in mind. In most cases, there is no magic button to convert from one system to another. This will be a full-fledged project which will take investigation, verification and most of all – Time.
For everyone involved in the conversion process, including developers, end users, project managers and stakeholders, make sure to create, publish and follow a project plan. As part of that plan, be certain the queries to be converted have been ranked in priority order. (For more information on some best practices for prioritization, check out this blog post.)
Step 2: Gather information
In order to recreate a query, or queries, it is important to know what the original code does, so it can be redeveloped in the new tool.
The best case scenario is when there is access to the SQL behind all of the reports that need to be converted. There may be some cases that this information is not readily available, such as tools that are quite complex, requiring IT staff intervention. However, in many tools, if the report developer has access to alter or create new queries, then there is likely a way to determine what the SQL looks behind the scenes.
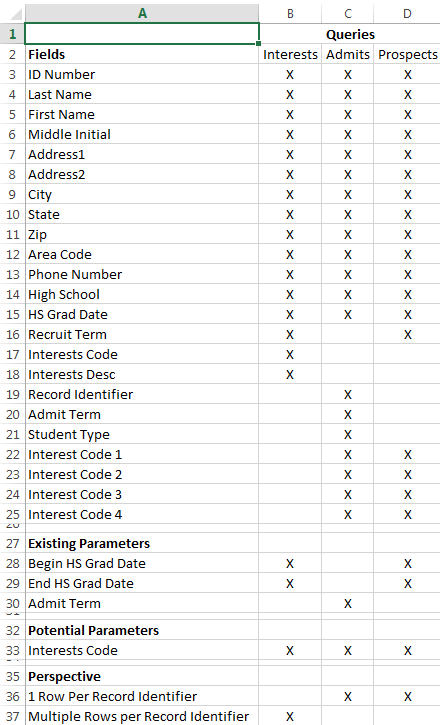
The next important step in the conversion process is to gather all of the various SQL statements that are intended to be combined into a new single query. A simple spreadsheet can be used to determine which queries can be combined and which queries need to stand alone. Create the spreadsheet by placing the fields to be included in the queries in each row, and the name of each query in the column headers. (See figure at right) Add an ‘X’ in the corresponding cells where each field is used in a query. Continue through each of the queries that appear to be similar in subject matter until each one has a column in the spreadsheet.
Below the fields, list the items the end user uses as input to a query. These can be either existing or potential ‘parameters,’ which are variables that make the query useful to a wider audience. Finally, below those sections, determine the number of rows per subject area expected for the results of the query. This is called ‘perspective’ of the report results. Frequently, a difference of perspective identifies where potential queries may need to be split into different sets of data.

Step 4: Create forms, parameters, and queries
Once the spreadsheet is complete, determine what combinations can be created for the group of queries in question. New report access forms, with the parameters identified in the spreadsheet, should be created in a format that meets an institution’s existing standards. The layout of the parameters should be in an order that meets the majority of end-user needs, yet remains pleasing to the eye.
Next, create the queries that will produce each of the fields listed in the spreadsheet, taking into account the existing and new parameters within the WHERE clause. For the sake of time, as most conversion projects are short on both time and resources, try to cut and paste the SQL queries where possible, accounting for any alterations that may need to be done for new reporting tools.
Finally, create the new reports that actually produce the output the end user is expecting. In most cases of query combination, this can be done by creating multiple reports against the new dataset in order to meet a variety of needs. It will be important to do thorough testing of the new query to ensure that the output for the queries is correct, comparing the old report results with the new results. If these results are different, then a further investigation needs to be done on both the old and new queries to see where the issues may be occurring. In some cases, the original report query was written to meet old criteria that are now invalid. If this happens, prepare documentation for the end users to show how the new reports differ from the old versions.
When all of the data verification is complete (by the developer and a handful of end users), it is best practice to introduce the new report access methods to the end-user community responsible for running the reports. This can be done in a variety of methods, from written documentation to hands-on instruction. There may be some resistance to the new report tool, the new access methods or even the end result set. Change management is a critical piece to helping end users acclimate to the new reports.
Conclusion
Report conversion can be a painstaking and laborious process, especially when the queries are large and complex. Each query must be reviewed not just as a single point of data access, but also as part of a larger group. This process is not one that should be completed by any one individual at an institution. This entire journey must be done as a cohesive group. This ensures that all queries are taken into consideration so that the end result is not just a replication of a reporting tool, but rather an enhancement and improvement to the end user’s experience. By taking the necessary time to do a thorough investigation and evaluation of the report library, an institution can guarantee a successful report conversion project.


0 Comments
0 Comments